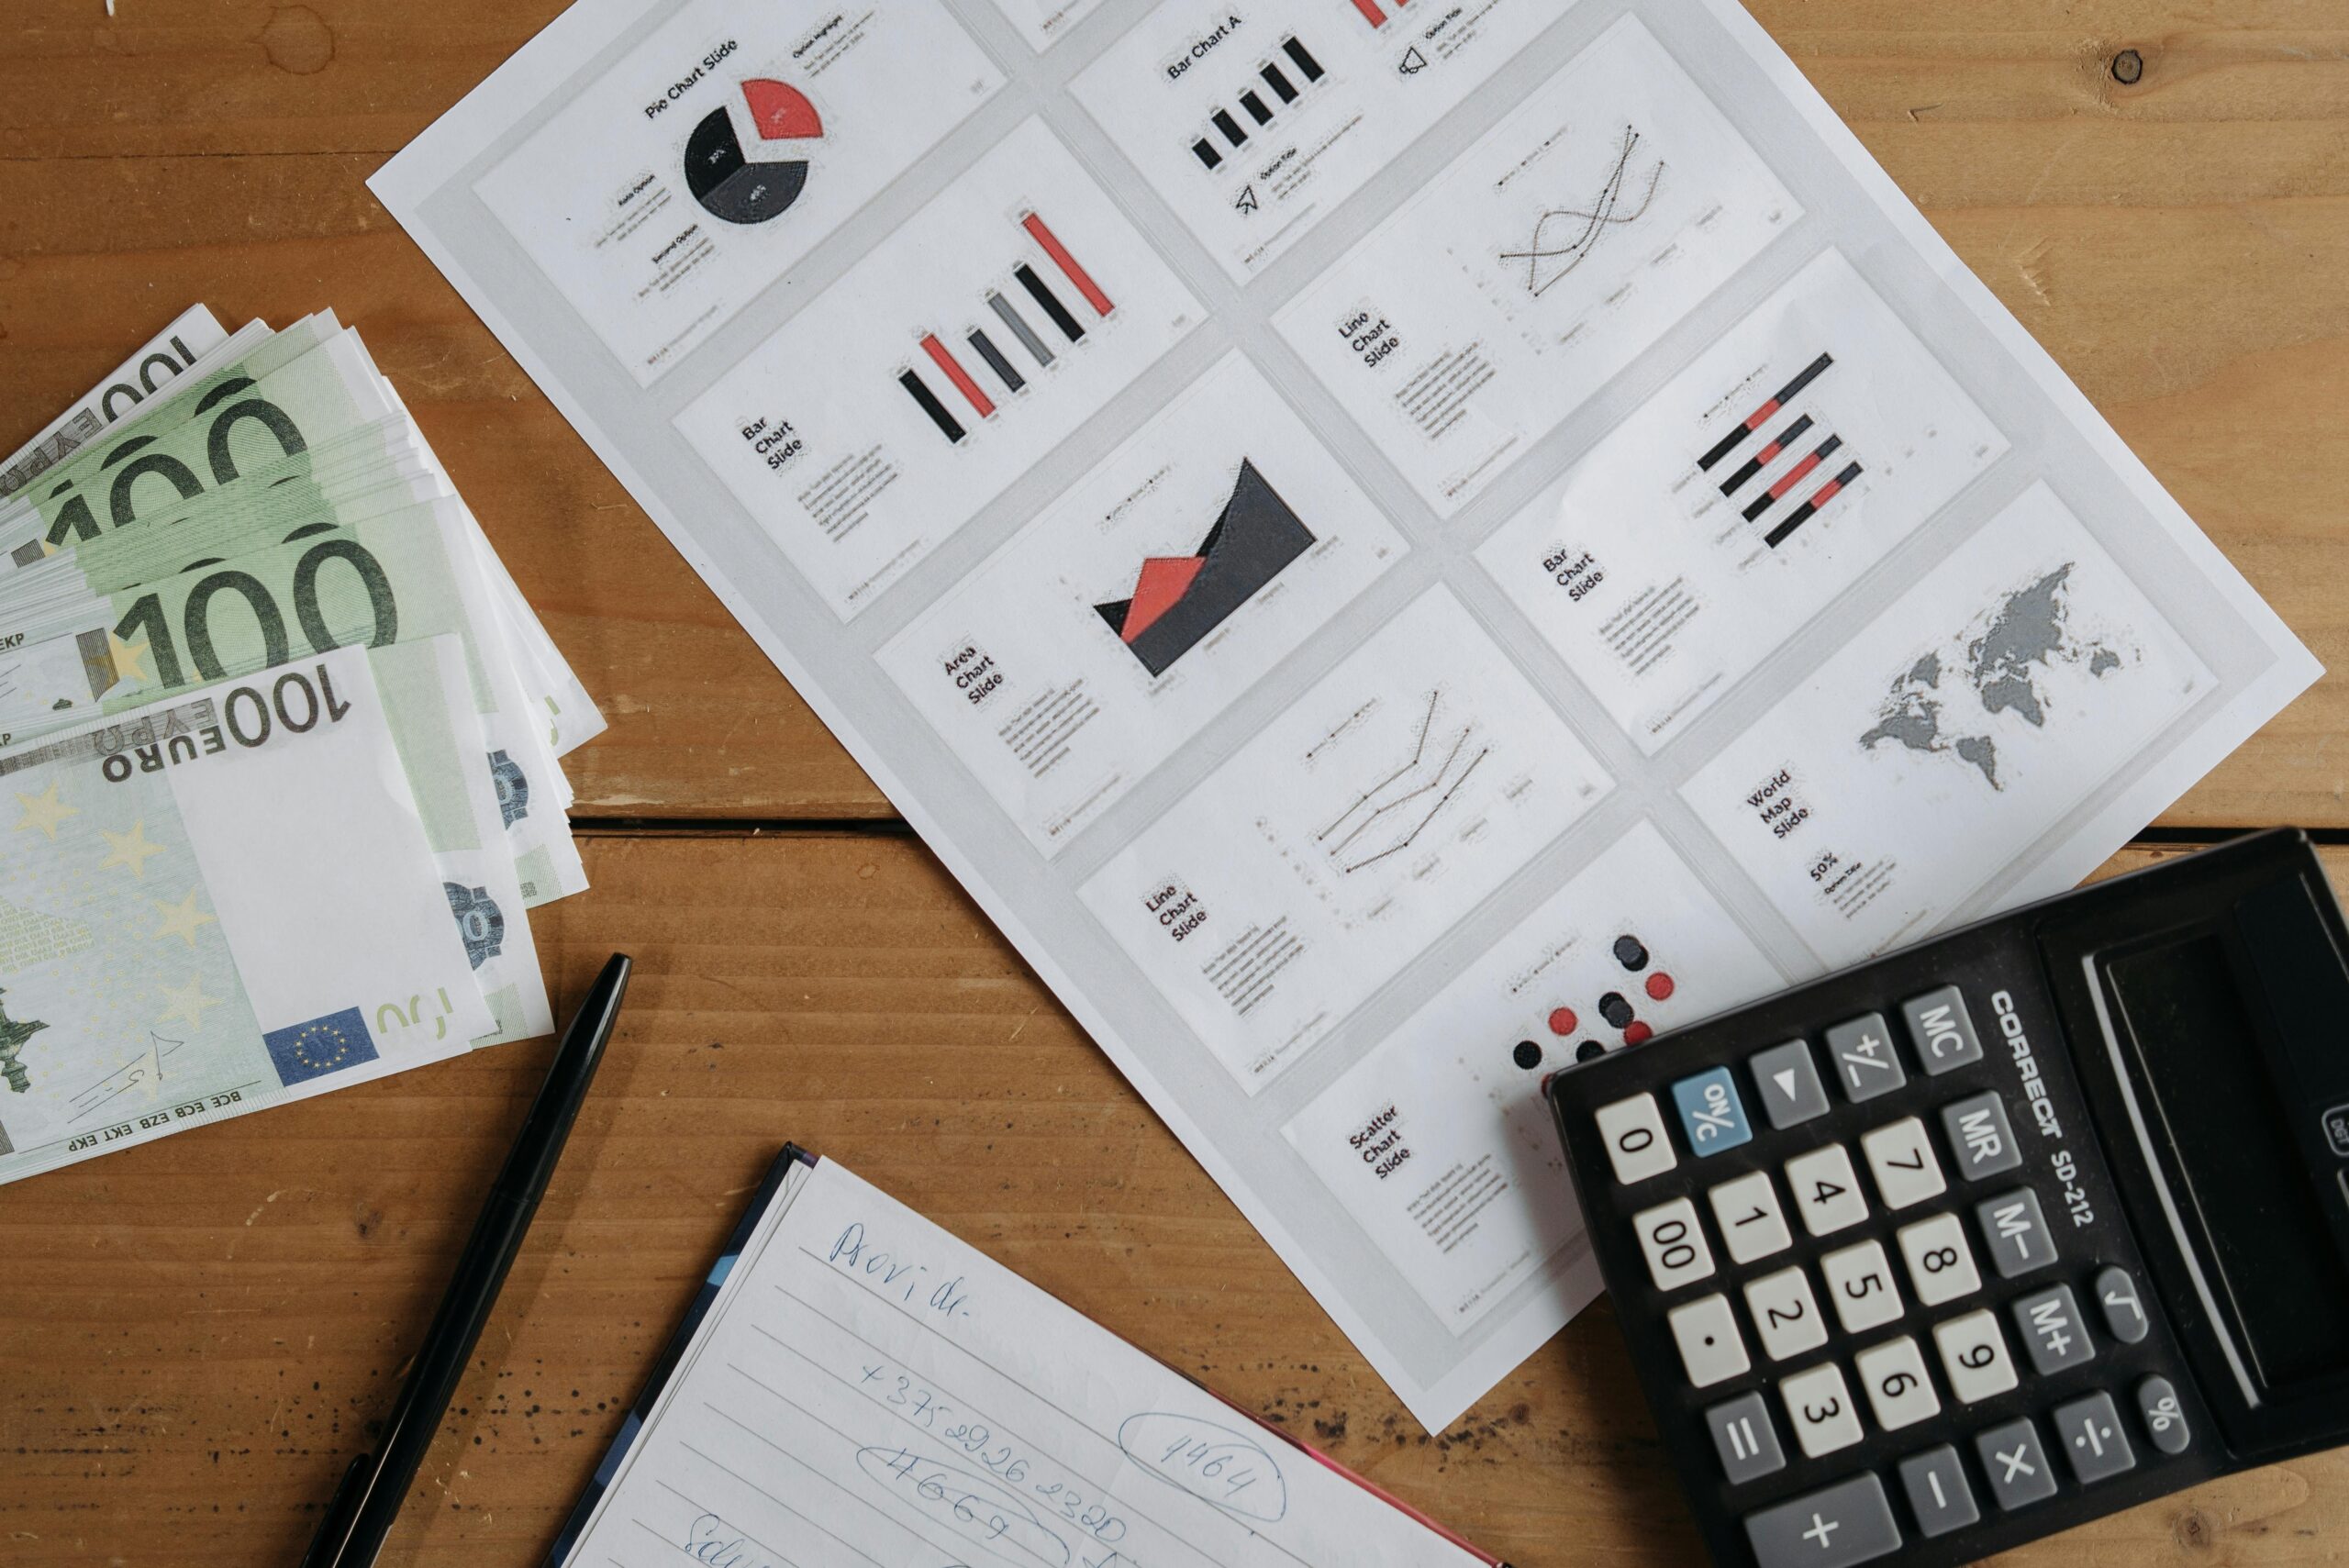
This post would provide a transparent and data-driven update on the foundation’s recent work. It could include figures like the number of meals served, families assisted, or people housed. Using infographics or simple charts would make the information easy to digest and would build trust with your donors.
This post would provide a transparent and data-driven update on the foundation’s recent work. It could include figures like the number of meals served, families assisted, or people housed. Using infographics or simple charts would make the information easy to digest and would build trust with your donors.
This post would provide a transparent and data-driven update on the foundation’s recent work. It could include figures like the number of meals served, families assisted, or people housed. Using infographics or simple charts would make the information easy to digest and would build trust with your donors.
This post would provide a transparent and data-driven update on the foundation’s recent work. It could include figures like the number of meals served, families assisted, or people housed. Using infographics or simple charts would make the information easy to digest and would build trust with your donors.